
Not Enough Data to display!
Average Overall
| Not Enough Data! / Avg statistics not populated yet. |
|---|
The NotAnotherSMAOffsetStrategy_uzi2 strategy is a trading strategy that utilizes various technical indicators to determine buy and sell signals. Here is a breakdown of its important components:
Indicator Population:
Exponential Moving Averages (EMA): Calculates EMA values for different time periods. Hull Moving Average (HMA): Calculates the HMA with a window of 50.
Zero-Lag Exponential Moving Average (ZLEMA): Calculates ZLEMA values with a time period of 10.
Simple Moving Average (SMA): Calculates SMA values with a time period of 9.
Elder's Force Index (EWO): Calculates the EWO using the specified fast and slow parameters. Relative Strength Index (RSI): Calculates RSI values with time periods of 14, 4, and 20. Bollinger Bands: Calculates the lower, middle, and upper bands using a window of 40 and 20. Buy Trend: Multiple buy conditions are defined based on different indicators and their respective parameters: RSI, close price, and EWO values should satisfy certain conditions. Moving averages (MA) and offset values are used to determine buy signals. Volume should be greater than zero. Sell Trend: Multiple sell conditions are defined based on different indicators and their respective parameters: Close price, MA, RSI, and volume values should satisfy certain conditions. The strategy incorporates moving average crossovers, RSI comparisons, and other factors to determine sell signals. Plot Configuration: Specifies the indicators to be plotted in the main chart, such as EMA, SMA, and HMA. Overall, the strategy combines various technical indicators, moving averages, and volume analysis to generate buy and sell signals in the backtesting process.
startup_candle_count : 400
EWO: 1.969%
Unable to parse Traceback (Logfile Exceeded Limit)
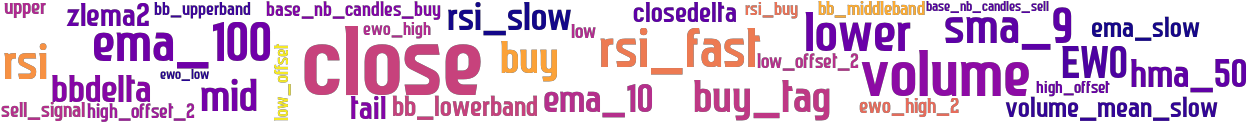
stoploss: -0.1
timeframe: 5m
hash(sha256): 3d39869ace8efec53f89e20659892be808fbce4ea44c1425fa3c0e9222ea8acf
indicators:
rsi_buy upper EWO ewo_high close
high_offset_2 ewo_low tail ewo_high_2 sell_signal
bb_lowerband bbdelta rsi_fast ma_sell_val ma_buy_val
volume low_offset closedelta high_offset low_offset_2
volume_mean_slow base_nb_candles_buy mid zlema2 base_nb_candles_sell
hma_50 buy buy_tag sma_9 ema_100
lower rsi_slow bb_middleband rsi ema_10
bb_upperband ema_slow low

Similar Strategies: (based on used indicators)

Strategy: tesla7, Similarity Score: 97.44%
Strategy: Tesla4_2, Similarity Score: 87.18%
Strategy: tesla4, Similarity Score: 87.18%
Strategy: tesla_4, Similarity Score: 87.18%
Strategy: tesla_5, Similarity Score: 87.18%
Strategy: tesla_6, Similarity Score: 87.18%
Strategy: test4, Similarity Score: 87.18%
Strategy: vinfast4, Similarity Score: 87.18%
Strategy: vinfast5, Similarity Score: 87.18%
Strategy: NASOSv5_marc, Similarity Score: 84.62%
Strategy: NASOSvSH1, Similarity Score: 82.05%
Strategy: NBO, Similarity Score: 82.05%
Strategy: NBO_2, Similarity Score: 82.05%

last change: 2025-01-08 10:32:45