
The CunCon strategy is a trading strategy that uses various indicators to generate buy and sell signals for backtesting. Here is a brief description of what the strategy does:
Populating Indicators:
Resamples the input data to a specified interval and factor. Calculates indicators such as CCI (Commodity Channel Index), RSI (Relative Strength Index), ADX (Average Directional Index), MFI (Money Flow Index), and their smoothed versions.
Computes Bollinger Bands and their middle, upper, and lower bands.
Calculates MACD (Moving Average Convergence Divergence) and its components.
Computes Bollinger Bands for entry signals with different parameters. Calculates bpercent (percentage between lower and upper Bollinger Bands) and bsharp (Bollinger Band sharpness) values. Computes smoothed versions of bsharp with different time periods. Calculates a combined indicator using smoothed RSI, MFI, and CCI. Applies TEMA (Triple Exponential Moving Average) to the combined indicator. Calculates candle size and average price. Populating Buy Trend: Determines buy signals based on the following conditions: Price conditions: A sequence of decreasing moving average values with the last value being below the previous one. Bollinger Bands condition: Price below the middle band. Indicators conditions: CCI below -100, RSI below 30, MFI below 30, or a combination of MFI below 10, CCI below -150, and RSI below MFI. Populating Sell Trend: Determines sell signals based on the following conditions: Indicator condition: The combined indicator (mfi_rsi_cci_smooth) crossing above 100 and then decreasing for at least two consecutive periods. Candle pattern condition: Eight consecutive green candles. Indicator and price conditions: CCI above 200 and RSI above 70. The strategy uses these buy and sell signals to generate trading decisions during backtesting. The Lopquethoi class is not fully visible in the provided code, so its purpose and functionality are unclear from this snippet.
Traceback (most recent call last): File "/freqtrade/freqtrade/main.py", line 42, in main return_code = args['func'](args) ^^^^^^^^^^^^^^^^^^ File "/freqtrade/freqtrade/commands/optimize_commands.py", line 58, in start_backtesting backtesting.start() File "/freqtrade/freqtrade/optimize/backtesting.py", line 1401, in start min_date, max_date = self.backtest_one_strategy(strat, data, timerange) ^^^^^^^^^^^^^^^^^^^^^^^^^^^^^^^^^^^^^^^^^^^^^^^^^^ File "/freqtrade/freqtrade/optimize/backtesting.py", line 1318, in backtest_one_strategy preprocessed = self.strategy.advise_all_indicators(data) ^^^^^^^^^^^^^^^^^^^^^^^^^^^^^^^^^^^^^^^^^ File "/freqtrade/freqtrade/strategy/interface.py", line 1378, in advise_all_indicators return {pair: self.advise_indicators(pair_data.copy(), {'pair': pair}).copy() ^^^^^^^^^^^^^^^^^^^^^^^^^^^^^^^^^^^^^^^^^^^^^^^^^^^^^^^^^^^^^^^^^^^^^^ File "/freqtrade/freqtrade/strategy/interface.py", line 1378, inreturn {pair: self.advise_indicators(pair_data.copy(), {'pair': pair}).copy() ^^^^^^^^^^^^^^^^^^^^^^^^^^^^^^^^^^^^^^^^^^^^^^^^^^^^^^^^ File "/freqtrade/freqtrade/strategy/interface.py", line 1410, in advise_indicators return self.populate_indicators(dataframe, metadata) ^^^^^^^^^^^^^^^^^^^^^^^^^^^^^^^^^^^^^^^^^^^^^ File "/freqtrade/user_data/strategies/chl.py", line 31, in populate_indicators dataframe = Lopquethoi.resample(dataframe, self.ticker_interval, self.resample_factor) ^^^^^^^^^^^^^^^^^^^^^^^^^^^^^^^^^^^^^^^^^^^^^^^^^^^^^^^^^^^^^^^^^^^^^^^^^^ File "/freqtrade/user_data/strategies/chl.py", line 265, in resample df = df.resample(str(int(interval[:-1]) * factor) + 'min', plotoschow=ohlc_dict) ^^^^^^^^^^^^^^^^^^^^^^^^^^^^^^^^^^^^^^^^^^^^^^^^^^^^^^^^^^^^^^^^^^^^^^^^^^^ TypeError: NDFrame.resample() got an unexpected keyword argument 'plotoschow'
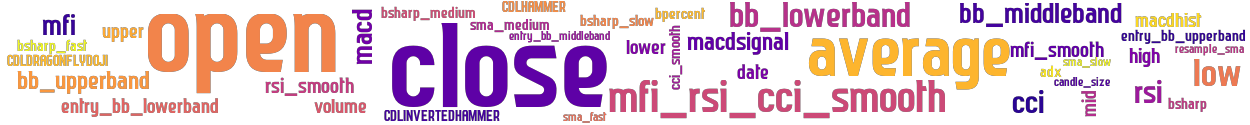
stoploss: -0.05
timeframe: 5m
hash(sha256): 09144643f9b3babc600a6d0d9f396d6305a29996514144fb8402d394a9cf6ef6
indicators:
mfi_rsi_cci_smooth mfi_smooth upper close entry_bb_middleband
mfi bb_lowerband macdhist bsharp_medium entry_bb_upperband
bsharp sma_slow average date sma_fast
open bsharp_slow entry_bb_lowerband high macdsignal
cci_smooth mid rsi_smooth cci sma_medium
macd bsharp_fast open high low
close candle_size adx lower bpercent
bb_middleband rsi bb_upperband low resample_sma

Similar Strategies: (based on used indicators)

Strategy: SmoothOperator, Similarity Score: 97.56%
Strategy: SmoothOperator_10, Similarity Score: 97.56%
Strategy: SmoothOperator_2, Similarity Score: 97.56%
Strategy: SmoothOperator_3, Similarity Score: 97.56%
Strategy: SmoothOperator_4, Similarity Score: 97.56%
Strategy: sample_strategy4, Similarity Score: 97.56%
Strategy: strategy_test, Similarity Score: 97.56%
Strategy: SmoothOperator_213, Similarity Score: 92.68%

last change: 2025-01-11 14:36:54