
Not Enough Data to display!
Average Overall
| Not Enough Data! / Avg statistics not populated yet. |
|---|
The ReinforcedQuickie strategy is a trading strategy that uses various technical indicators to generate buy and sell signals for a given financial instrument. Here is a brief description of what the strategy does:
Indicator Population: The strategy begins by populating several technical indicators on the input dataframe. These indicators include exponential moving averages (EMA) of different time periods, Bollinger Bands, minimum and maximum values, Commodity Channel Index (CCI), Money Flow Index (MFI), Relative Strength Index (RSI), average price, and Moving Average Convergence Divergence (MACD).
Buy Signal Generation: The strategy defines conditions for generating a buy signal.
It looks for specific patterns in the indicators and the price data.
The buy signal conditions include: Price crossing below certain EMAs, being at the minimum, and below the lower Bollinger Band. A specific pattern in the average price and its previous values, along with certain conditions for the low, CCI, RSI, and MFI. Volume being lower than a rolling mean and other conditions related to a resampled simple moving average. Sell Signal Generation: The strategy defines conditions for generating a sell signal. It looks for specific patterns in the indicators and the price data. The sell signal conditions include: Price crossing above certain EMAs, being at the maximum, and above the upper Bollinger Band. A specific pattern in the open and close prices along with certain conditions for RSI and MFI. Data Preparation: The strategy performs additional data preparation steps before returning the updated dataframe. It sets the index of the dataframe to the date, resamples the data to a specified interval, calculates a resampled simple moving average, and interpolates missing values. Overall, the ReinforcedQuickie strategy uses a combination of technical indicators and specific price patterns to generate buy and sell signals for trading.
startup_candle_count : 50
ema_21: -0.011%
rsi: 0.269%
Biased Indicators
resample_sma
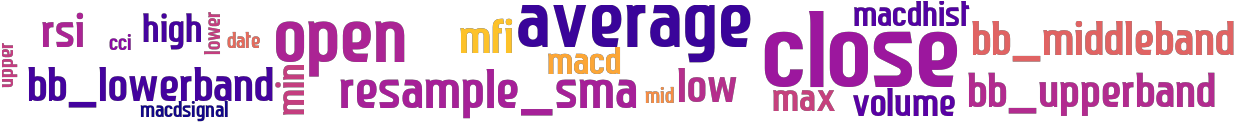
stoploss: -0.99
timeframe: 5m
hash(sha256): c5f6a6ed9f8b01f45cff616a8049e966c006cad1f11a23a4a6964516eaea6ddf
indicators:
upper close bb_lowerband mfi macdhist
volume average date max open
high macdsignal mid cci macd
open high low close min
lower bb_middleband rsi bb_upperband low
resample_sma

Similar Strategies: (based on used indicators)

Strategy: DuperFivish, Similarity Score: 96.3%
Strategy: Leveraged, Similarity Score: 96.3%
Strategy: ReinforcedQuickie, Similarity Score: 96.3%
Strategy: ReinforcedQuickieHyperStrategy, Similarity Score: 96.3%
Strategy: ReinforcedQuickie_2, Similarity Score: 96.3%
Strategy: ReinforcedQuickie_253, Similarity Score: 96.3%
Strategy: ReinforcedQuickie_3, Similarity Score: 96.3%
Strategy: ReinforcedQuickie_4, Similarity Score: 96.3%
Strategy: YouPig, Similarity Score: 96.3%
Strategy: SmoothOperator_4, Similarity Score: 88.89%

last change: 2023-07-04 01:07:34