
The KeltnerBounce strategy is a trading strategy that utilizes various technical indicators to generate buy and sell signals. Here is a brief description of what the strategy does:
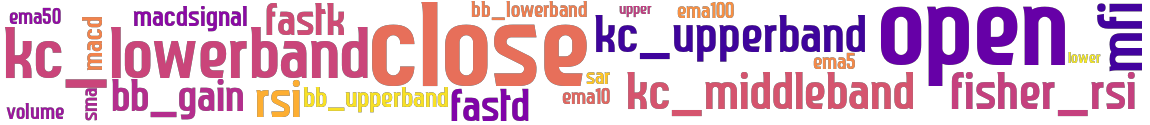
The strategy populates several technical indicators on the provided DataFrame, including:
Money Flow Index (MFI)
Moving Average Convergence Divergence (MACD)
Stochastic Fast Oscillator (STOCHF)
Relative Strength Index (RSI)
Fisher Transform of RSI
Keltner Channels (upper, lower, and middle bands)
Bollinger Bands (upper and lower bands)
Bollinger Band Gain
Exponential Moving Averages (EMAs) of different time periods
Parabolic SAR (SAR)
Simple Moving Average (SMA)
The populate_entry_trend function determines the buy signal based on the following conditions:
Volume is greater than 0
If enabled, MFI is less than or equal to a specified value
If enabled, Fisher Transform of RSI is less than or equal to a specified value
If enabled, Bollinger Band Gain is greater than or equal to a specified value
The candle (price range) enters the lower Keltner band and is green
The populate_exit_trend function determines the sell signal based on the condition that the candle (price) crosses above the upper Keltner band. Overall, the strategy aims to identify potential buying opportunities when the price is within the lower Keltner band and satisfies additional conditions, while it generates a sell signal when the price crosses above the upper Keltner band.
stoploss: 0
timeframe: 5m
hash(sha256): 01a93a3c7332fd7972f0218dbf0a3d436b5c1d8d14f937445f757f7801487223
indicators:
upper close bb_gain mfi bb_lowerband
ema5 fastk sma kc_middleband kc_lowerband
volume open fastd ema10 sar
macdsignal fisher_rsi ema100 macd kc_upperband
lower rsi bb_upperband ema50

Similar Strategies: (based on used indicators)

Strategy: KeltnerBounce, Similarity Score: 96%

last change: 2024-07-27 15:18:11