
You will be redirected to the original Strategy in 15 seconds.
The strategy implemented in the code is called CombinedBinHClucAndMADV9. Here's a short description of what the strategy does:
The strategy uses various indicators to determine buy and sell signals for trading. During the initialization, the strategy populates indicators on different timeframes (1-hour and normal timeframe) using the provided dataframe and metadata.
In the buy signal generation, the strategy applies multiple conditions using different indicators and their respective values.
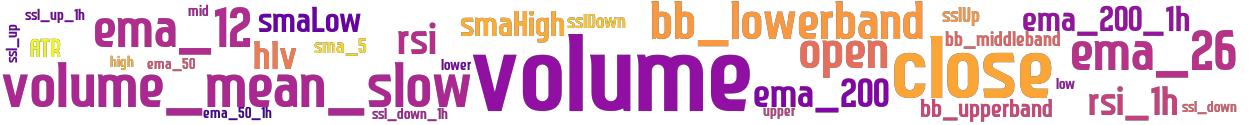
These conditions include checks on the close price relative to moving averages (ema_200 and ema_200_1h), Bollinger Bands (bb_lowerband and bb_upperband), volume indicators (volume_mean_slow and volume), and other technical indicators such as RSI (relative strength index) and MACD (moving average convergence divergence).
The strategy checks for multiple combinations of these conditions, enabling or disabling them based on user-defined settings (buy_condition_1_enable, buy_condition_2_enable, etc.). If any of the conditions are satisfied, the strategy marks the corresponding entry in the dataframe as 'buy' (1). In the sell signal generation, the strategy looks for a condition where the close price is higher than 1% above the Bollinger Bands' middle band (bb_middleband) and the volume is greater than 0. If this condition is met, the strategy marks the corresponding entry in the dataframe as 'sell' (1). Overall, the CombinedBinHClucAndMADV9 strategy combines multiple technical indicators to generate buy and sell signals for trading based on the specified conditions.
In the buy signal generation, the strategy applies multiple conditions using different indicators and their respective values.
These conditions include checks on the close price relative to moving averages (ema_200 and ema_200_1h), Bollinger Bands (bb_lowerband and bb_upperband), volume indicators (volume_mean_slow and volume), and other technical indicators such as RSI (relative strength index) and MACD (moving average convergence divergence).
The strategy checks for multiple combinations of these conditions, enabling or disabling them based on user-defined settings (buy_condition_1_enable, buy_condition_2_enable, etc.). If any of the conditions are satisfied, the strategy marks the corresponding entry in the dataframe as 'buy' (1). In the sell signal generation, the strategy looks for a condition where the close price is higher than 1% above the Bollinger Bands' middle band (bb_middleband) and the volume is greater than 0. If this condition is met, the strategy marks the corresponding entry in the dataframe as 'sell' (1). Overall, the CombinedBinHClucAndMADV9 strategy combines multiple technical indicators to generate buy and sell signals for trading based on the specified conditions.
stoploss: -0.99
timeframe: 5m
hash(sha256): 51addbd7b3093c63be993734561141d3b5e200a2140b7cb23343aaa3aca9c781

Was not able to fetch indicators from Strategyfile.

last change: 2023-04-21 15:46:22